Active Projects | Port Authority of New York and New Jersey
Port Authority of New York and New Jersey explores significant cost savings with Blyncsy
The Port Authority of New York and New Jersey (PANYNJ) conducted a pilot project with Blyncsy to inspect 100 centerline miles of roads. This automated, AI-powered inspection focused on pavement markings and a pavement condition assessment, sign assets (including MUTCD classification) and sign retroreflectivity.
25%
Initial annual savings using Blyncsy compared to traditional procedures
48%
Savings over a five-year period with Blyncsy compared to traditional methods
Lorem ipsum dolor sit amet, consectetur adipiscing elit. Ut elit tellus, luctus nec ullamcorper mattis, pulvinar dapibus leo.
John Doe
Designer
Solving Unique Challenges
The Port Authority of New York and New Jersey oversees much of the regional transportation infrastructure, including bridges, tunnels, airports, and seaports, within the geographical jurisdiction of the Port of New York and New Jersey.
The Port Authority operates the Port Newark–Elizabeth Marine Terminal, the largest on the Eastern Seaboard. The Port Authority also operates six bi-state crossings: three connecting New Jersey with Manhattan, and three connecting New Jersey with Staten Island. The Port Authority Bus Terminal and the PATH rail system are also run by the Port Authority, as well as LaGuardia Airport, John F. Kennedy International Airport, Newark Liberty International Airport, Teterboro Airport and Stewart International Airport.
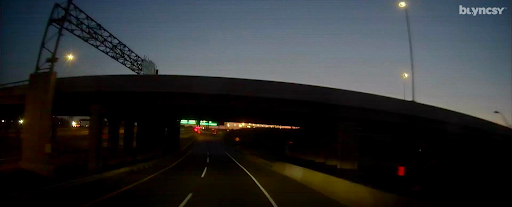
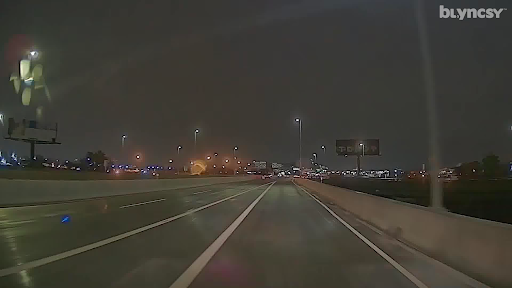
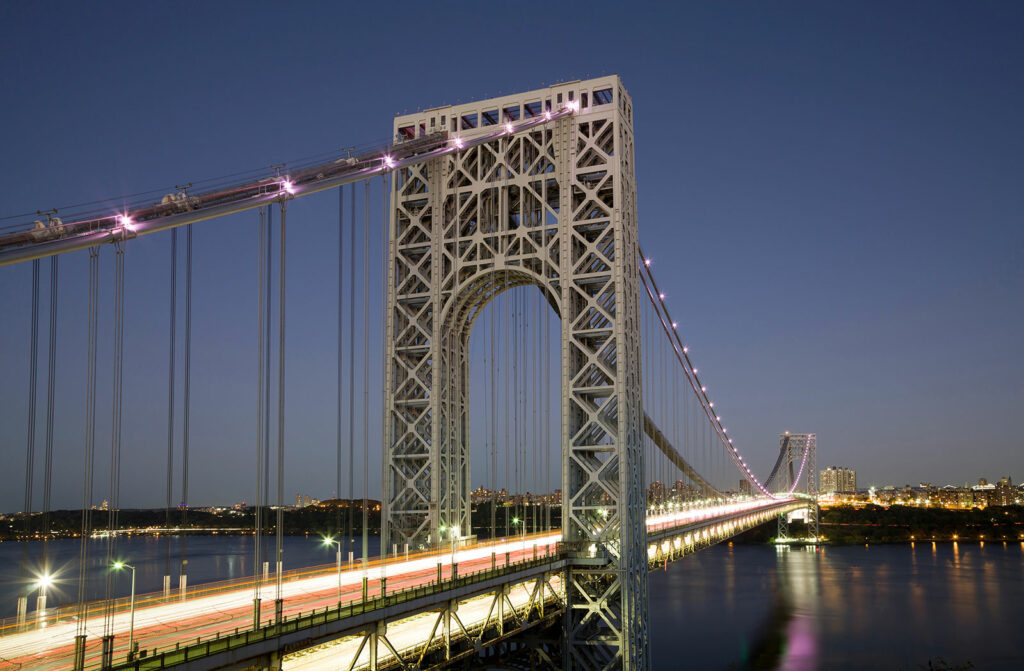
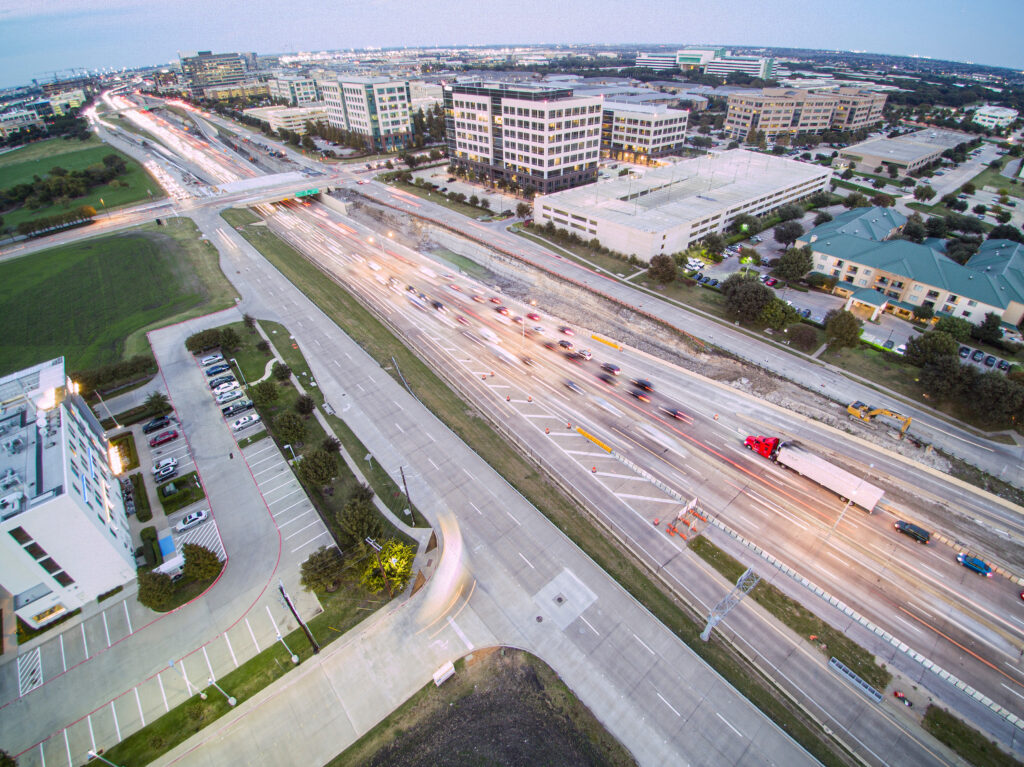
Managing all of these facilities and the thousands of miles of road is a monumental task, so to become more efficient and effective at keeping these roadways in top shape, PANYNJ embarked on an ambitious pilot project with Blyncsy to conduct automated inspection and analysis of roads at four key locations representing each of the major areas the Port Authority manages; JFK Airport, the George Washington Bridge (both upper and lower levels), the Lincoln Tunnel, and the Port Network.
Key Performance Indicators
The Port Authority of New York and New Jersey had a straightforward goal to measure success from this project. PANYNJ was expecting a near 50% reduction in surveying and associated costs of detecting predefined infrastructure assets, and confirmation through manual in-field inspections and data validation of 90% accuracy of insights delivered. Finally, PANYNJ looked to incorporate the data in a minimum of four workflows or use cases.
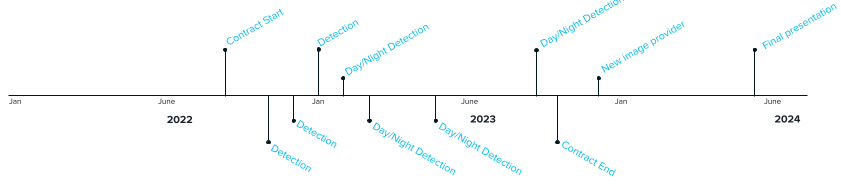
Blyncsy Methodology
Blyncsy collected over 8,000,000 total images from eight independent deliveries on specified PANYNJ roads. Once images were collected, the data was input into Blyncsy’s computer vision and AI models to automatically analyze every image for the chosen detections; pavement markings, pavement condition assessment, sign assets and retroreflectivity.
Paintline Scoring
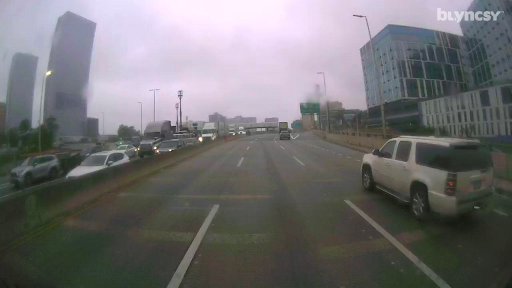
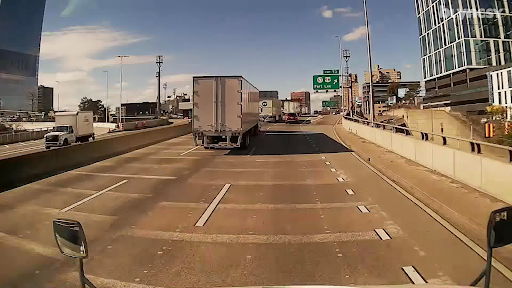
As Blyncsy did with the retroreflectivity scoring, the adjustment to a new image provider allowed Blyncsy’s computer vision models to more accurately assess road paint lines. In fact, the accuracy increased 14% after changing to a higher-quality image.
Retroreflectivity Scoring
As Blyncsy did with the retroreflectivity scoring, the adjustment to a new image provider allowed Blyncsy’s computer vision models to more accurately assess road paint lines. In fact, the accuracy increased 14% after changing to a higher-quality image.
Before image provider change
After image provider change
Cost Savings
Upon completion of the initial project, PANYNJ concluded in their cost savings analysis that they would see a 25% initial annual savings using Blyncsy compared to traditional asset inventory procedures. The Port Authority also concluded that over a five-year period, that cost savings would rise to 48% compared to manual inspections.