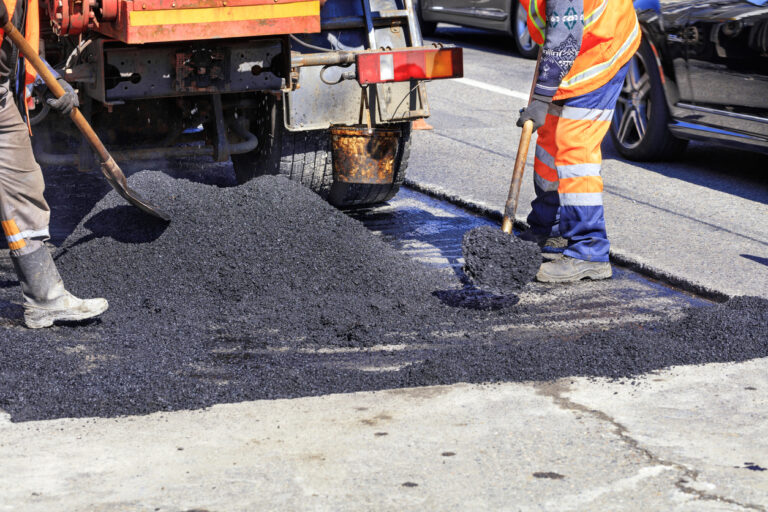
Transportation agencies nationwide face a familiar challenge: assets degrade steadily while funding and staff rarely keep pace with the growing demand. Pavement cracks deepen, signs fade, guardrails bend, and roadside vegetation creeps into view, leaving teams scrambling for solutions. Google Street View is helping address this challenge by offering a unique record of roadway change that agencies can now analyze more effectively.
Asset managers have lacked this long-term perspective for decades, often relying on reactive decision-making. A new class of infrastructure data platforms is beginning to change that reality. These systems merge archival imagery with modern data streams, creating a longitudinal view of roadway networks that enables smarter planning and maintenance.
The Value of Longitudinal Data
Traditional road surveys offer a point-in-time snapshot. While these snapshots may be useful, they cannot explain how quickly assets are degrading or whether an early intervention could extend their lifespan.
Longitudinal data changes that equation. A record that stretches back years allows planners to see an asset’s current state and estimate the pace of change and deterioration. For example, if a section of pavement shows visible cracking in 2020 imagery and worsens significantly by 2023, the agency can quantify the rate of degradation. That trendline is more actionable than a single survey because it allows for better forecasting and budget alignment.
The U.S. Federal Highway Administration (FHWA) has emphasized the importance of performance management in infrastructure management, underscoring the need for reliable data to track outcomes over time. Longitudinal imagery is an essential piece of that performance story.

Google Street View as a Road Network Time Machine
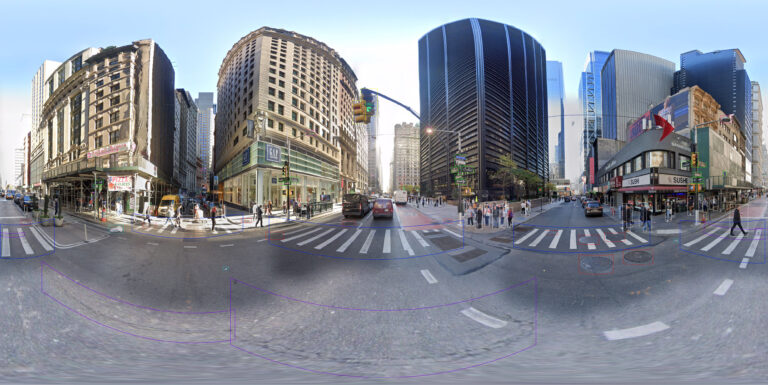
Most Americans know the platform for its consumer-facing features. They appreciate the ability to click through panoramic images of neighborhoods. For transportation professionals, Street View is even more powerful. It presents a historical record of roadway conditions that, in some places, stretches back 15 years and more.
This historical archive of visuals effectively acts as a “time machine” for transportation assets. By scrolling through Street View images from 2008 to today, agencies can observe how signs have faded and how other conditions might have deteriorated. In other words, the technology becomes a comprehensive visual memory.
Of course, in isolation, Street View images are still anecdotal. The true innovation comes from combining this imagery with modern analytics. Fusing past and present data enables infrastructure platforms to track subtle changes across thousands of miles of roadway at scale. Instead of revisiting assets manually every year, agencies can rely on digital archives that automatically surface changes that need to be prioritized.

Change Detection as a Planning Tool
Change detection describes the ability to identify what has been altered between two points in time and is a crucial part of predictive asset management. Fields like agriculture and environmental monitoring have long used remote sensing to track shifts in vegetation or land use; applying the same principle to roads and road infrastructure creates a new layer of efficiency for transportation agencies.
Consider the example of traffic signs. A manual inspection might confirm the reflectivity of a stop sign today, but it will not reveal how much that reflectivity has degraded since the original installation. Historical imagery allows agencies to pinpoint when deterioration began and how quickly it is accelerating, enabling maintenance teams to schedule replacement before visibility becomes a safety hazard.
The same applies to pavement conditions. A single survey might show the extent of cracking, but only a longitudinal record shows whether that cracking developed over three or ten years. That difference can inform budget planning and choosing the right treatment method, from a simple seal coat to a full-scale reconstruction.
How Historical Context Can Drive Efficiency Gains
The efficiency gains from longitudinal data are two-fold:
- Agencies can optimize their inspection resources by focusing on assets that show measurable change rather than inspecting every asset at the same frequency
- Agencies can align budgets with actual degradation rates, reducing costly emergency repairs
This efficiency can become essential in an era of limited public funding and common budget concerns. The American Society of Civil Engineers’ 2025 Infrastructure Report Card rates nationwide roadway conditions as a “D” grade, with deferred maintenance creating a potential multi-billion dollar funding gap. Historical imagery enables agencies to stretch their limited budgets by prioritizing assets most likely to break down soon.
The Next Step: Fusing Historical and Real-Time Data
While historical data provides valuable context, it can only be part of the equation. Moving from reactive maintenance to predictive asset management requires agencies to gather and analyze a steady stream of current data to pair with archival and historical imagery. This fusion, in turn, transforms the time machine of Google Street View into a forward-looking tool.
Infrastructure data platforms create a living record that spans past, present, and future by continuously integrating new imagery. The past becomes a baseline, while the present adds current condition assessments to estimate future degradation.
This approach enables agencies to ask forward-looking questions. How many more years until a sign may fall below reflectivity standards? When will a stretch of pavement move from “fair” to “poor” condition? Combining longitudinal with real-time data enables the answer to these questions to become far more accurate predictions.

Google Street View for Smarter Transportation Planning
Infrastructure data platforms that combine historical imagery with continuous new data streams create a new opportunity for transportation planning. They allow agencies to track change at scale, forecast future needs, and align limited budgets with real degradation trends.
How Blyncsy Can Enable Transportation Agencies to Optimize Change Detection
Blyncsy is at the forefront of building this capability. Partnering with Google Street View enables the software to add a historical baseline to its continuous imagery intelligence platform. This fusion, in turn, allows agencies to see their networks’ current state and measure how assets have changed over time. The result is a perpetual survey, thanks to a data set that is constantly growing and updating for more informed decision-making.
This approach offers a new path forward for transportation leaders tasked with stretching their budget while improving safety and equity. Rather than guessing or waiting for failures, they can make decisions confidently, backed by a continuous historical record of their road networks.